

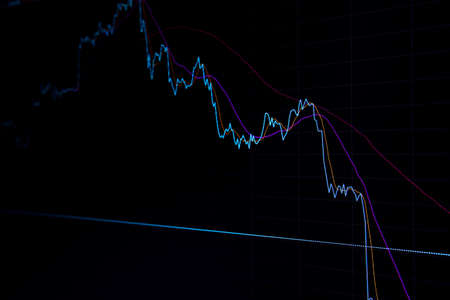
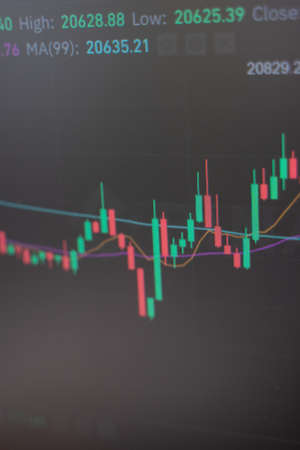
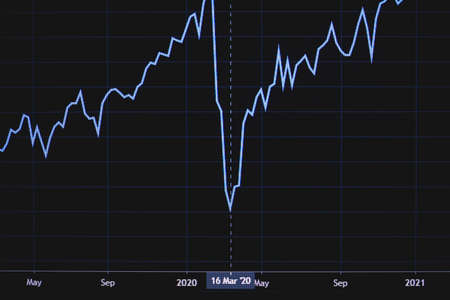
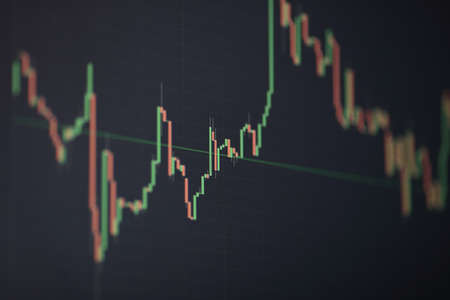
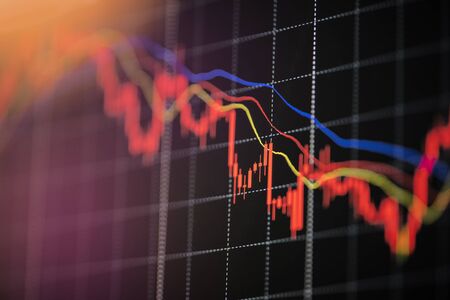
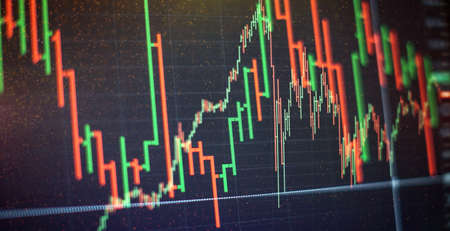
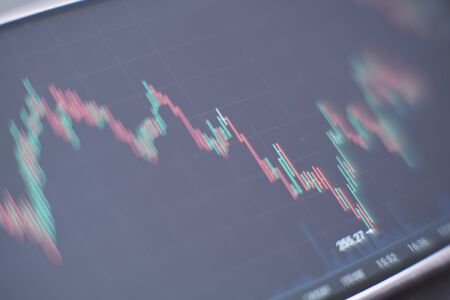
Shallow depth of field (selective focus) with details of a chart showing the stock market crash from March 2020 due to the Covid-19 pandemic on a computer screen (S&P500 index)
Коллекция по умолчанию
Коллекция по умолчанию
Создать новую

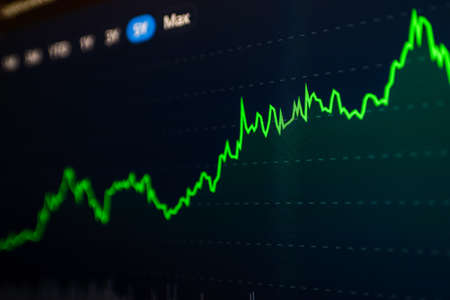
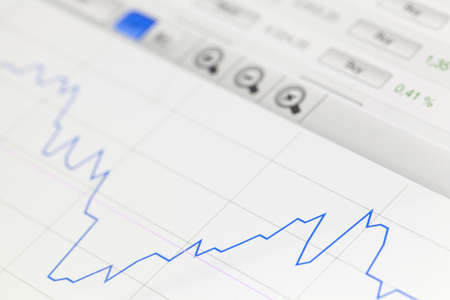
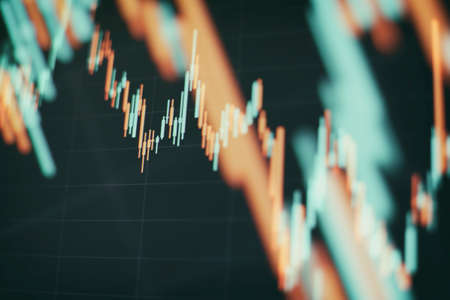
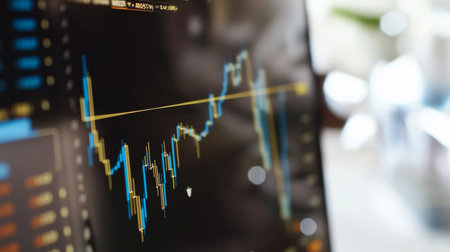
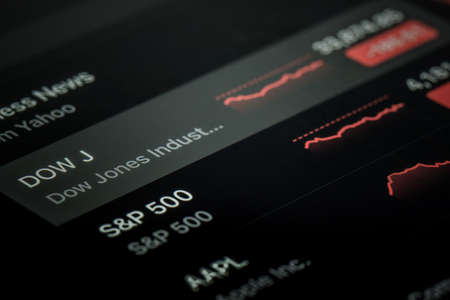
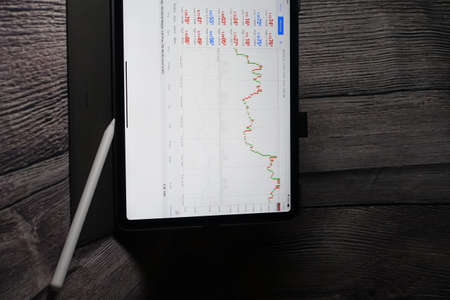
image is a graph of financial development on a computer monitor.
Коллекция по умолчанию
Коллекция по умолчанию
Создать новую
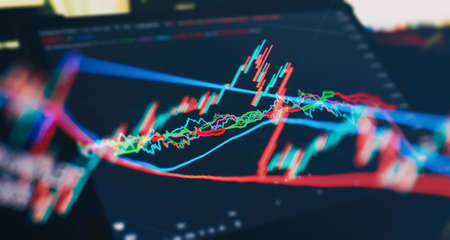
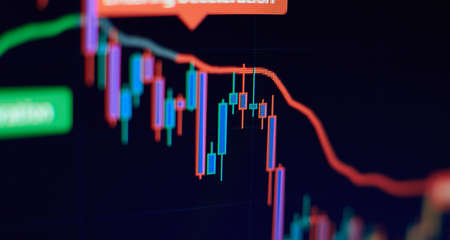
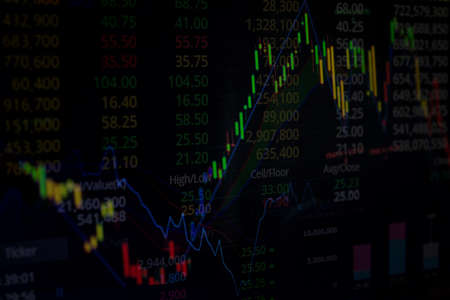
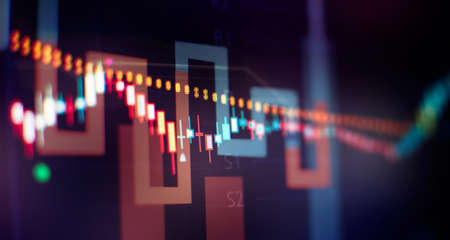
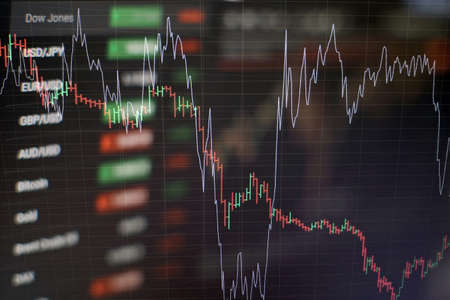
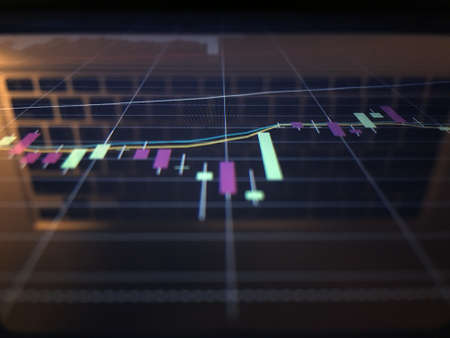
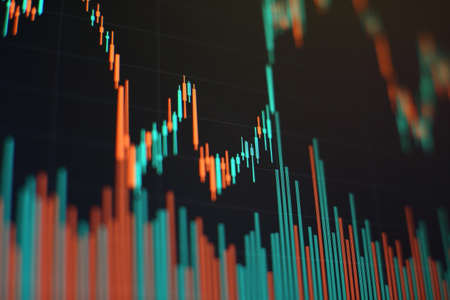
securities price chart on the monitor screen
Коллекция по умолчанию
Коллекция по умолчанию
Создать новую

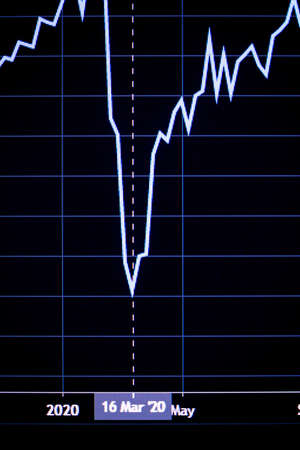
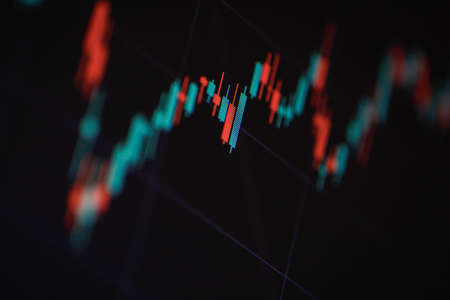
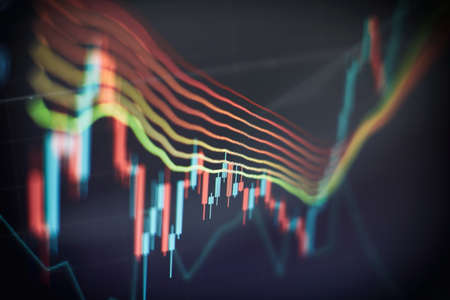
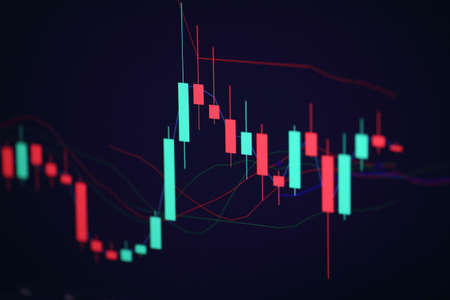
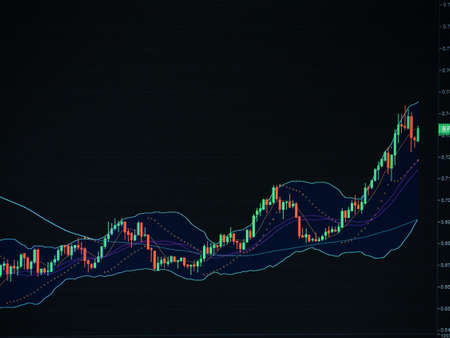
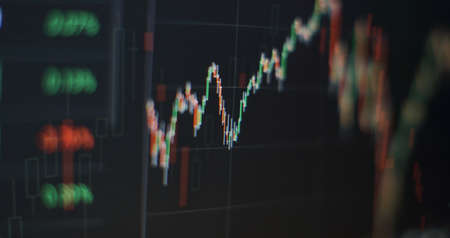
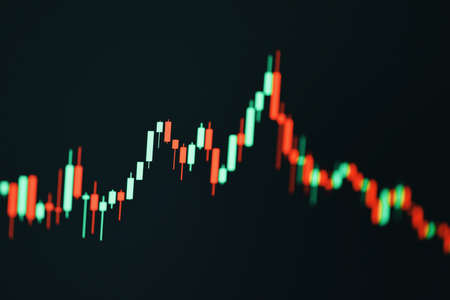
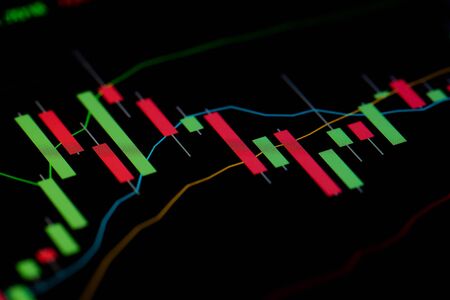
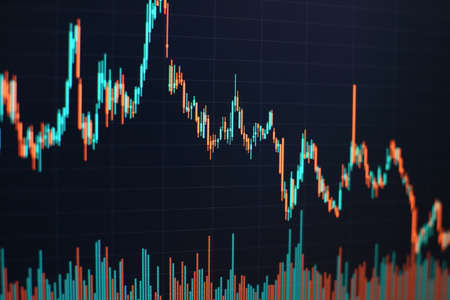
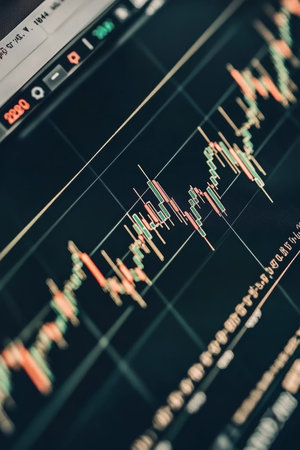
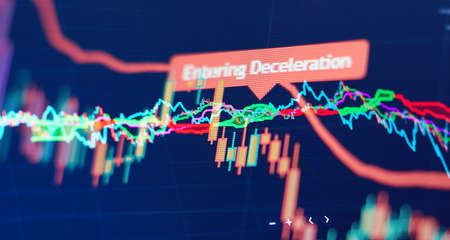
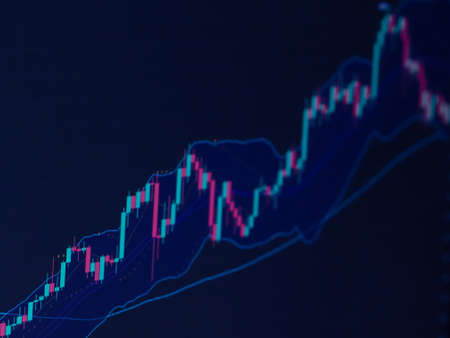
Shallow depth of field (selective focus) with details of a candlestick chart on a computer screen.
Коллекция по умолчанию
Коллекция по умолчанию
Создать новую
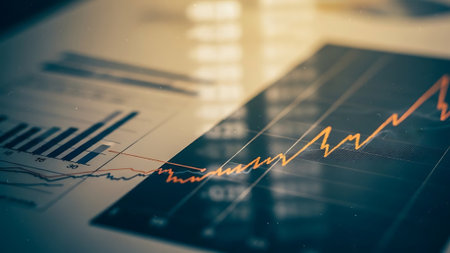
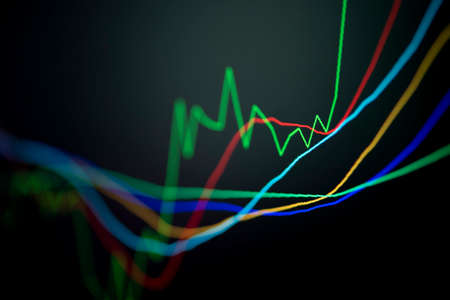
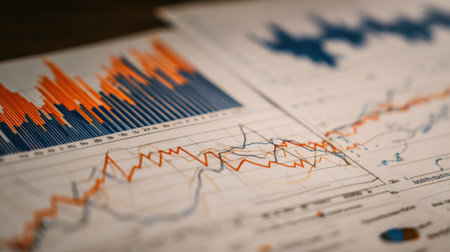
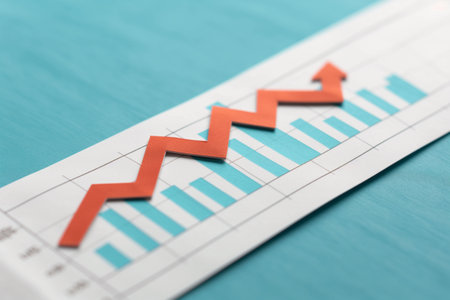
Grow Stock market trading graph in graphic concept.financial investment or economic trends business design. Abstract finance background.Low angle shot.
Коллекция по умолчанию
Коллекция по умолчанию
Создать новую

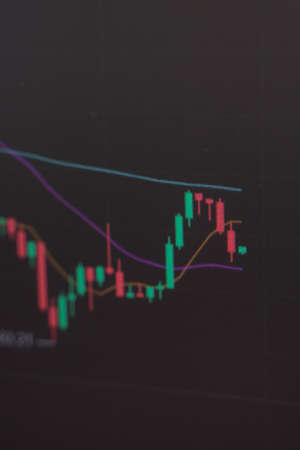
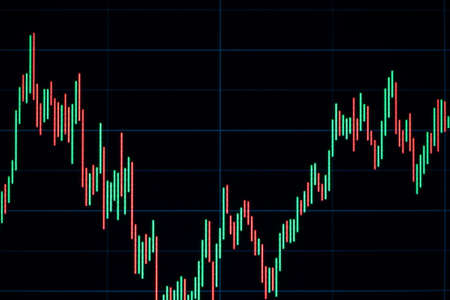
Shallow depth of field (selective focus) with details of a candlestick chart on a computer screen.
Коллекция по умолчанию
Коллекция по умолчанию
Создать новую

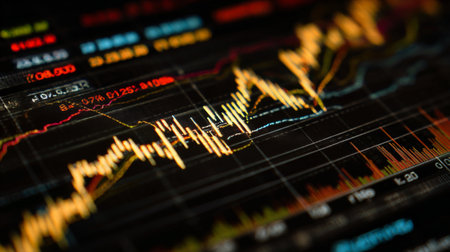
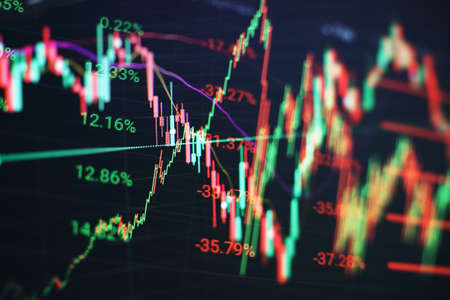
image of the financial graph on a computer monitor.
Коллекция по умолчанию
Коллекция по умолчанию
Создать новую
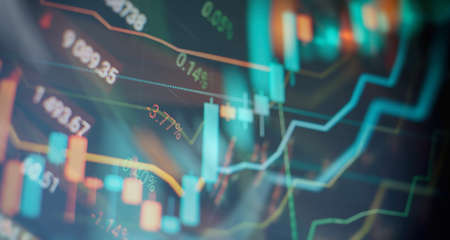
Business statistics and Analytics value . Abstract glowing forex chart interface background. Investment, trade, stock, finance and analysis concept.
Коллекция по умолчанию
Коллекция по умолчанию
Создать новую
Shallow depth of field (selective focus) with details of a chart showing the stock market crash from March 2020 due to the Covid-19 pandemic on a computer screen (S&P500 index)
Коллекция по умолчанию
Коллекция по умолчанию
Создать новую
Shallow depth of field (selective focus) with details of a candlestick chart on a computer screen.
Коллекция по умолчанию
Коллекция по умолчанию
Создать новую
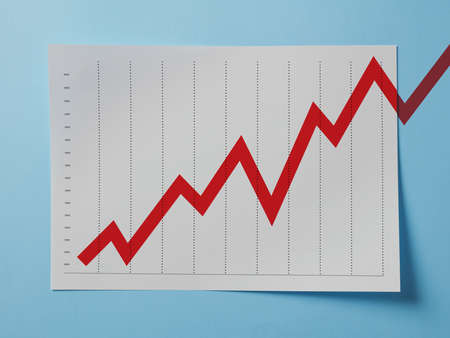
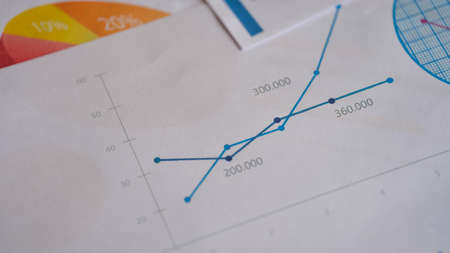
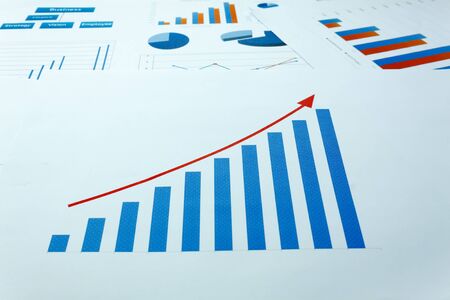
Growing chart on A4 page on blue background
Коллекция по умолчанию
Коллекция по умолчанию
Создать новую
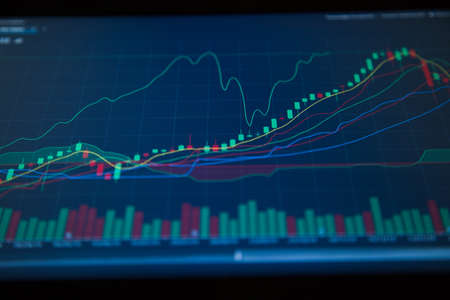
Stock Market Chart on Blue Background. share drop down and stock up
Коллекция по умолчанию
Коллекция по умолчанию
Создать новую
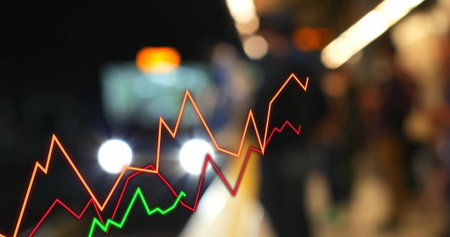
Waiting commuter wearing dark coat on night station platform, oncoming headlights. Urban, transit, public, transportation, night
Коллекция по умолчанию
Коллекция по умолчанию
Создать новую
Abstract graphic consisting of blurred points , graph and chart . information concept.
Коллекция по умолчанию
Коллекция по умолчанию
Создать новую
Stock or business market analysis concept. Business financial or stock market background.
Коллекция по умолчанию
Коллекция по умолчанию
Создать новую
Bitcoin. Change the price on the display. Brokerage information, display of the price of the electronic means of payment
Коллекция по умолчанию
Коллекция по умолчанию
Создать новую
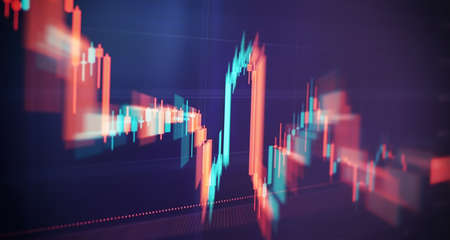
Stock market or forex trading graph and candlestick chart suitable for financial investment concept. Abstract finance background.
Коллекция по умолчанию
Коллекция по умолчанию
Создать новую

Our profits are on the rise. Shot of paperwork and stationery on a desk in an empty office during the day.
Коллекция по умолчанию
Коллекция по умолчанию
Создать новую
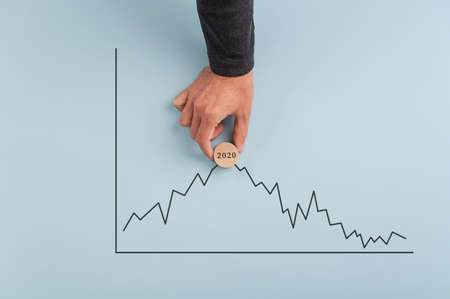
Male hand placing a wooden cut circle with 2020 sign on it on top of a statistical graph just befor a decline, predicting a stock market crisis.
Коллекция по умолчанию
Коллекция по умолчанию
Создать новую
Change the stock market chart. The fall in the value of cryptocurrencies. Brokerage data
Коллекция по умолчанию
Коллекция по умолчанию
Создать новую

Statistical financial graph predicting an economic depression after a 2020 global coronavirus pandemic.
Коллекция по умолчанию
Коллекция по умолчанию
Создать новую

Stock market graph on screen. Ticker on monitor screen. Investing, Finance and Economic concept. Shallow depth of field.
Коллекция по умолчанию
Коллекция по умолчанию
Создать новую
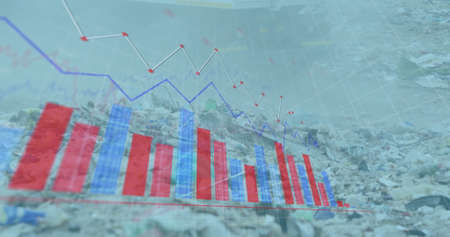
Image of financial data processing over a garbage dump. Digitalinterface global finance and business concept digitally generated image.
Коллекция по умолчанию
Коллекция по умолчанию
Создать новую
Sustainable portfolio management, long term wealth management with risk diversification concept.
Коллекция по умолчанию
Коллекция по умолчанию
Создать новую
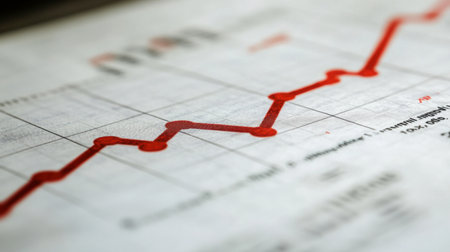
A detailed line graph shows financial trends marked by an upward movement, reflecting analysis of data for improved decision-making processes.
Коллекция по умолчанию
Коллекция по умолчанию
Создать новую
Stock market trading graph in graphic concept.financial investment or economic trends business design. Abstract finance background.Low angle shot.
Коллекция по умолчанию
Коллекция по умолчанию
Создать новую
Red growth arrow on blue background. Arrow graph going up. The economic growth
Коллекция по умолчанию
Коллекция по умолчанию
Создать новую
Economic graph with diagrams on the stock market, for business and financial concepts and reports.
Коллекция по умолчанию
Коллекция по умолчанию
Создать новую
Business or Financial Reference: Displaying stock market data, stock exchange or chart on a monitor, stock market chart, stock exchange or chart. stock market investment trading chart.
Коллекция по умолчанию
Коллекция по умолчанию
Создать новую
Financial graphic chart
Коллекция по умолчанию
Коллекция по умолчанию
Создать новую

Economy trends background for business idea and all art work design. Abstract finance background.
Коллекция по умолчанию
Коллекция по умолчанию
Создать новую
Stock Market Loss Trading Chart Investment Analysis Business Index Chart Finance Board Chart
Коллекция по умолчанию
Коллекция по умолчанию
Создать новую
Forex graph business or Stock graph line chart market exchange ,Technical price line with indicator on chart computer screen background, Stock trading graphic design for financial investment trade
Коллекция по умолчанию
Коллекция по умолчанию
Создать новую
Close-up of a business chart showing a rising trend line, symbolizing growth and progress in financial performance. Ideal for economic insights.
Коллекция по умолчанию
Коллекция по умолчанию
Создать новую
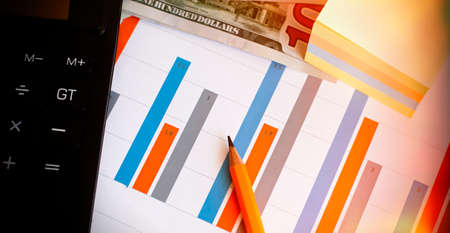
top view of business chart on white table with pencil and calculator
Коллекция по умолчанию
Коллекция по умолчанию
Создать новую
Shallow depth of field (selective focus) with details of a chart showing the stock market crash from March 2020 due to the Covid-19 pandemic on a computer screen (S&P500 index)
Коллекция по умолчанию
Коллекция по умолчанию
Создать новую

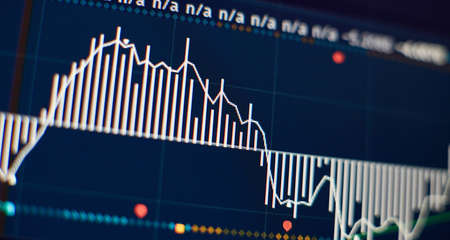
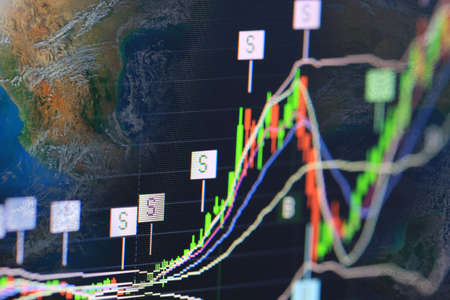
Stock index on the computer monitor . Financial data on a monitor which including of Market Analyze. Bar graphs, Diagrams, financial figures.
Коллекция по умолчанию
Коллекция по умолчанию
Создать новую
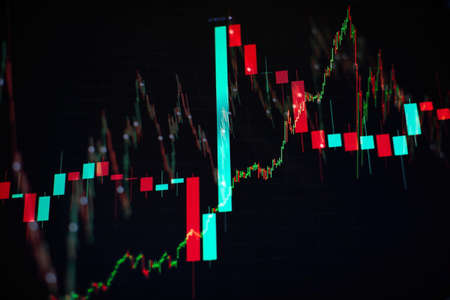
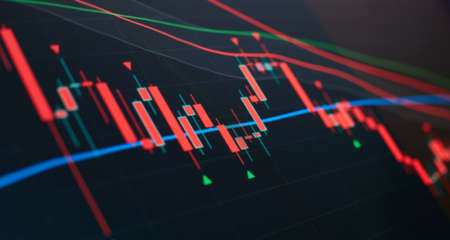
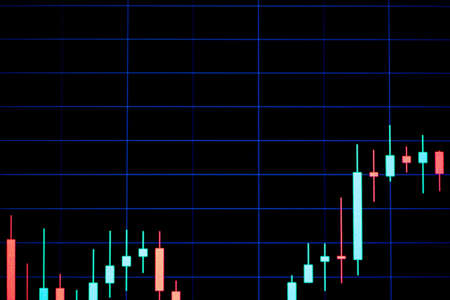
Technical price graph and indicator, red and green candlestick chart on blue theme screen, market volatility, up and down trend. Stock trading, crypto currency background.
Коллекция по умолчанию
Коллекция по умолчанию
Создать новую
The business plan at the meeting and analyze financial numbers to view the performance of the company.
Коллекция по умолчанию
Коллекция по умолчанию
Создать новую
Stock market or forex trading graph in graphic concept suitable for financial investment or Economic trends business idea and all art work design.
Коллекция по умолчанию
Коллекция по умолчанию
Создать новую
Abstract financial graph with candle stick and bar chart of stock market on financial background
Коллекция по умолчанию
Коллекция по умолчанию
Создать новую
Forex graph business or Stock graph chart market exchange ,Technical price candlestick with indicator on chart computer screen background, Stock trading graphic design for financial investment trade
Коллекция по умолчанию
Коллекция по умолчанию
Создать новую
Close up shot on digital screen Candlestick Chart of stock market change and volatility prices profit or loss
Коллекция по умолчанию
Коллекция по умолчанию
Создать новую

Stock index on the computer monitor . Financial data on a monitor which including of Market Analyze. Bar graphs, Diagrams, financial figures.
Коллекция по умолчанию
Коллекция по умолчанию
Создать новую
An uptrend, increased sales, or increased value. graphic arrows pointing upwards on black background for banner, design or text insert
Коллекция по умолчанию
Коллекция по умолчанию
Создать новую
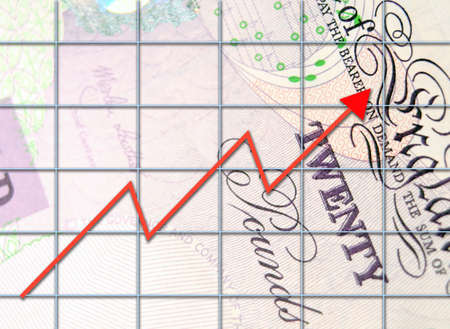
Profit graph overlaid onto twenty pound currency note.
Коллекция по умолчанию
Коллекция по умолчанию
Создать новую

Business success and growth concept.Stock market business graph chart on digital screen. Stock trading, crypto currency background.
Коллекция по умолчанию
Коллекция по умолчанию
Создать новую
Stock or business market analysis concept. Business financial or stock market background.
Коллекция по умолчанию
Коллекция по умолчанию
Создать новую
Abstract finance curve blue background Investment, marketing concept.Blurred background.
Коллекция по умолчанию
Коллекция по умолчанию
Создать новую
Digital Finance: Analyzing Volatile Market Graphs and Managing Tiered Compensation Schedules on a Desktop.
Коллекция по умолчанию
Коллекция по умолчанию
Создать новую

Abstract glowing forex chart interface wallpaper. Investment, trade, stock
Коллекция по умолчанию
Коллекция по умолчанию
Создать новую
graph with diagrams on the stock market, for business and financial concepts and reports.Abstract blue background.
Коллекция по умолчанию
Коллекция по умолчанию
Создать новую
A close-up view of a blue and black line graph on a white background, showcasing trends and data analysis essential for business reporting and decision-making.
Коллекция по умолчанию
Коллекция по умолчанию
Создать новую
Documents with colourful charts, graphs and diagrams
Коллекция по умолчанию
Коллекция по умолчанию
Создать новую
Business graph. Bullish Bearish trend. Candlestick chart uptrend downtrend . Stock trade on online market forex.
Коллекция по умолчанию
Коллекция по умолчанию
Создать новую
Financial accounting of profit summary graphs analysis.
Коллекция по умолчанию
Коллекция по умолчанию
Создать новую
Businessman hand working on analyzing investment charts for Gold market, Forex market and Trading market.
Коллекция по умолчанию
Коллекция по умолчанию
Создать новую

Business chart with line graph, bar chart and numbers on dark background, 3d rendering. Computer digital drawing.
Коллекция по умолчанию
Коллекция по умолчанию
Создать новую

data on a monitor which including of Market Analyze. Bar graphs, Diagrams, financial figures. Forex chart.
Коллекция по умолчанию
Коллекция по умолчанию
Создать новую
Fundamental and technical analysis concept.
Коллекция по умолчанию
Коллекция по умолчанию
Создать новую
Medium shot of a closeup on charts and graphs illustrating loan interest rate fluctuations over time
Коллекция по умолчанию
Коллекция по умолчанию
Создать новую

The business plan at the meeting and analyze financial numbers to view the performance of the company.
Коллекция по умолчанию
Коллекция по умолчанию
Создать новую
Double exposure of abstract creative financial chart and upward arrow illustration on modern corporate office background, research and strategy concept
Коллекция по умолчанию
Коллекция по умолчанию
Создать новую
Economic graphic. Financial chart, stock analysis data for business background in digital screen. Graphics growth forex finance market. Stock analyzing. Price chart bars
Коллекция по умолчанию
Коллекция по умолчанию
Создать новую

Working set for analyzing financial statistics and analyzing a market data. Data analyzing from charts and graph to find out the result.
Коллекция по умолчанию
Коллекция по умолчанию
Создать новую
This image showcases an abstract view of financial data with colorful graphs and lines on a black background, highlighting various trends in stock market performance analysis.
Коллекция по умолчанию
Коллекция по умолчанию
Создать новую
Stock crash market exchange loss trading graph analysis investment indicator business graph charts of financial digital background down stock crisis red price in down trend chart fall
Коллекция по умолчанию
Коллекция по умолчанию
Создать новую
stock indexes in virtual space. Economic growth, recession. Electronic virtual platform showing trends and stock market fluctuations
Коллекция по умолчанию
Коллекция по умолчанию
Создать новую
A vibrant 3D arrow rising along a bar graph on paper, symbolizing growth and positive trends in business or financial performance. High quality photo
Коллекция по умолчанию
Коллекция по умолчанию
Создать новую
Economic graph with diagrams on the stock market, for business and financial concepts and reports.Abstract blue background.
Коллекция по умолчанию
Коллекция по умолчанию
Создать новую
Financial chart with trading data and technical analysis tools, Stock Market, investment, trading
Коллекция по умолчанию
Коллекция по умолчанию
Создать новую

Business success and growth concept.Stock market business graph chart on digital screen.Forex market, Gold market and Crude oil market
Коллекция по умолчанию
Коллекция по умолчанию
Создать новую
Stock market chart. Graphics growth forex finance market on tablet screen. Financial chart, stock analysis data background. Business growth, progress or success concept
Коллекция по умолчанию
Коллекция по умолчанию
Создать новую

Image of financial data processing over cityscape. global finance, business and digital interface concept digitally generated image.
Коллекция по умолчанию
Коллекция по умолчанию
Создать новую

Data analyzing from charts and graph to find out the result.
Коллекция по умолчанию
Коллекция по умолчанию
Создать новую

Business financial or stock market background. Business graph on stock market,
Коллекция по умолчанию
Коллекция по умолчанию
Создать новую
Close-up of a financial graph on a computer screen, showcasing upward and downward trends with detailed line and bar charts.
Коллекция по умолчанию
Коллекция по умолчанию
Создать новую
financial instruments with various types of indicators including volume analysis for professional technical analysis on the monitor of a computer.
Коллекция по умолчанию
Коллекция по умолчанию
Создать новую
Businessman hand working on analyzing investment charts for Gold market, Forex market and Trading market.
Коллекция по умолчанию
Коллекция по умолчанию
Создать новую
A stock market graph on a black background.
Коллекция по умолчанию
Коллекция по умолчанию
Создать новую
Thailand Stock Exchange, Trading screen, Stock market.
Коллекция по умолчанию
Коллекция по умолчанию
Создать новую
Economic graph with diagrams on the stock market, for business and financial concepts
Коллекция по умолчанию
Коллекция по умолчанию
Создать новую
A defocused candlestick chart with an indicator showing an uptrend or downtrend in stock market or online stock trading, investment and financial concepts.
Коллекция по умолчанию
Коллекция по умолчанию
Создать новую
Female hand with smartphone trading stock online. Business concept
Коллекция по умолчанию
Коллекция по умолчанию
Создать новую

Concept of stock market and fintech.Abstract financial trading graphs on monitor.
Коллекция по умолчанию
Коллекция по умолчанию
Создать новую
Computer and business strategy as concept. Financial diagram with candlestick chart used in market analysis
Коллекция по умолчанию
Коллекция по умолчанию
Создать новую
Trading forex with METATRADER 4 on Apple iPad Pro 11 inch. iPad Pro is the most user friendly which good for people on the go.
Коллекция по умолчанию
Коллекция по умолчанию
Создать новую
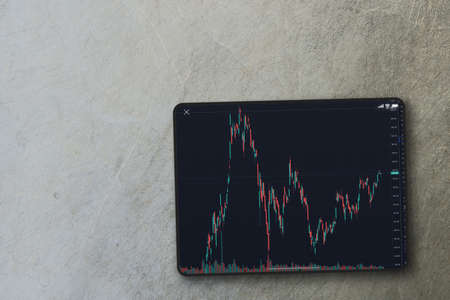
Financial stock market graph on the tablet screen on cement background. Top view. Stock Exchange.
Коллекция по умолчанию
Коллекция по умолчанию
Создать новую
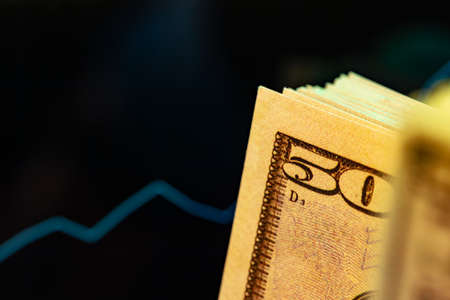
American dollar banknotes and graph on black background
Коллекция по умолчанию
Коллекция по умолчанию
Создать новую
stock chart
Коллекция по умолчанию
Коллекция по умолчанию
Создать новую
business background grown up concept the business chart document background.
Коллекция по умолчанию
Коллекция по умолчанию
Создать новую
Detailed view of a graph displayed on a digital screen, showing trend analysis for website traffic flow, Incorporate trend analysis for website traffic fluctuations
Коллекция по умолчанию
Коллекция по умолчанию
Создать новую
Stock trading, crypto currency background.The business plan at the meeting and analyze financial numbers to view the performance of the company.
Коллекция по умолчанию
Коллекция по умолчанию
Создать новую

Chart on LED display concept. A large display of daily stock market price and quotation. indicator financial forex trade
Коллекция по умолчанию
Коллекция по умолчанию
Создать новую
Business financial or stock market background. Business graph on stock market financial exchange
Коллекция по умолчанию
Коллекция по умолчанию
Создать новую
A close-up financial chart with an uptrend line candle chart on the stock or cryptocurrency market on a black monitor background. Investment chart of the stock or cryptocurrency market with indicators
Коллекция по умолчанию
Коллекция по умолчанию
Создать новую
Trading chart and candlestick chart suitable for financial investment ideas, economic trends, background for all business ideas and art designs
Коллекция по умолчанию
Коллекция по умолчанию
Создать новую
Shallow depth of field (selective focus) with details of a candlestick chart on a computer screen.
Коллекция по умолчанию
Коллекция по умолчанию
Создать новую
financial chart on the digital screen. concept of market analysis and investment.
Коллекция по умолчанию
Коллекция по умолчанию
Создать новую
Charts of financial instruments for technical analysis. Data analyzing in forex market trading: the charts and summary info for forexmaking trading.
Коллекция по умолчанию
Коллекция по умолчанию
Создать новую
Legion-Media
Создайте свои проекты на основе качественных стоковых фотографий и видео.


Copyright © Legion-Media.